

Request a demo specialized to your need.
A portfolio of active studies doesn't sit still. Some are still being scoped in Planning, others are deep in Start Up, several are actively Enrolling, a few are winding down in Closing, and one or two might be sitting On Hold for reasons that easily get lost between status meetings. Tracking all of that through a spreadsheet or a static report means someone has to manually reconstruct the shape of the portfolio every time a leader asks "where do things actually stand right now" and by the time that reconstruction is done, a study may have already moved.
What a Study Portfolio Kanban View Actually Shows
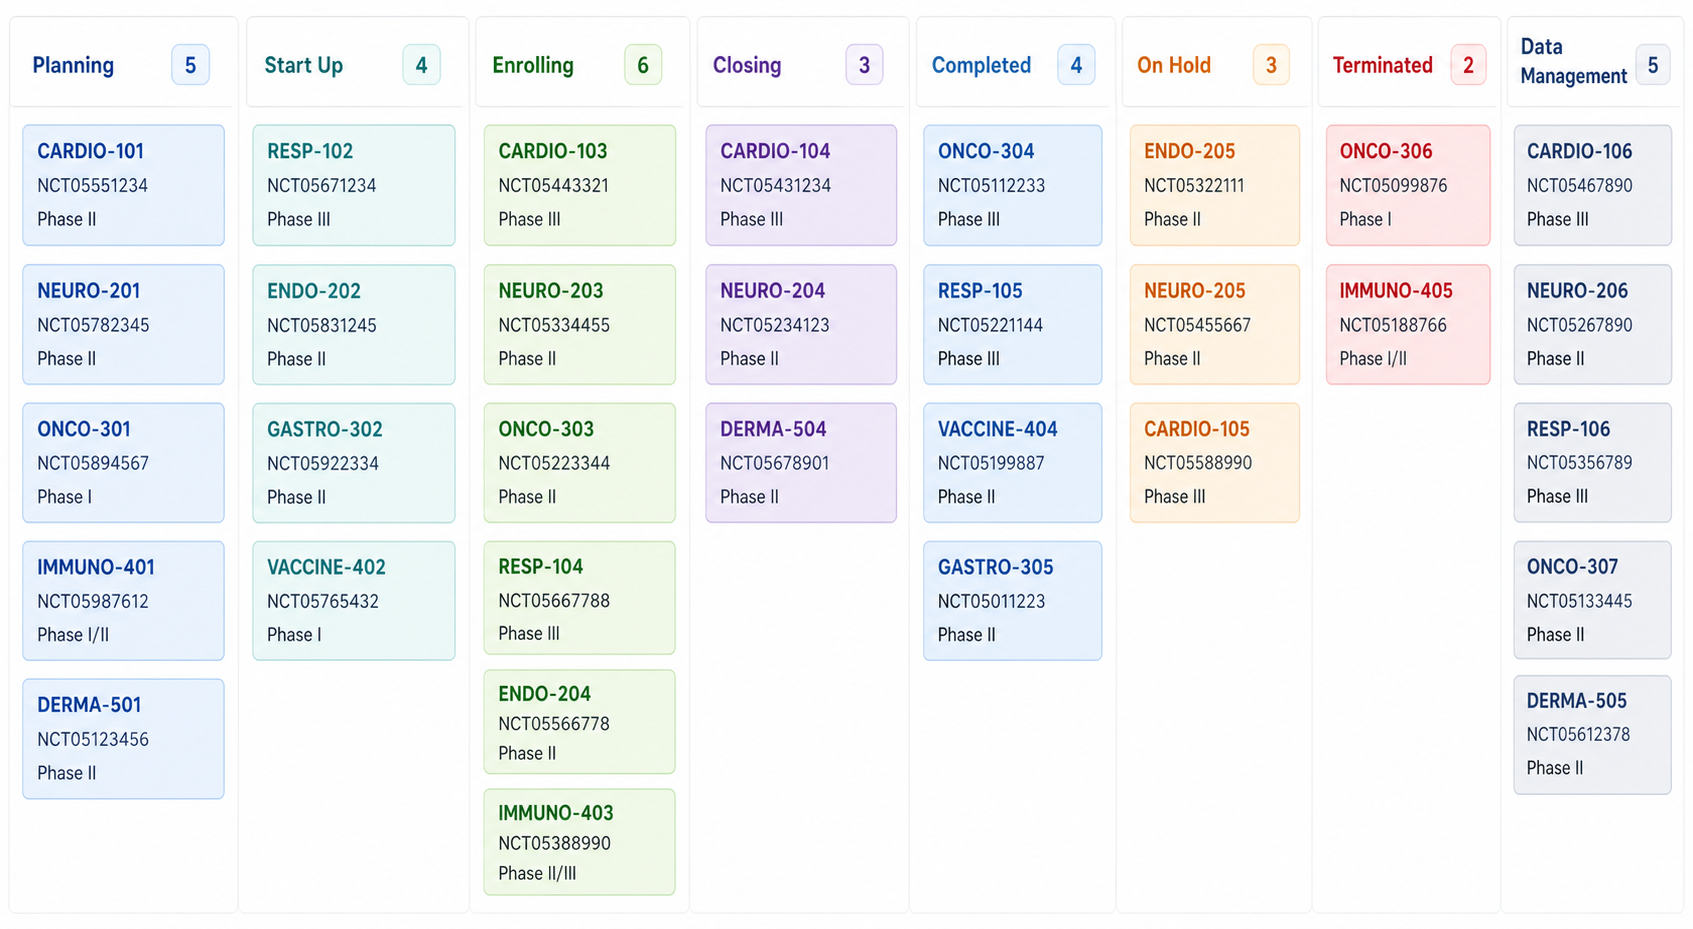
A Kanban view represents each study as a card and groups those cards into columns by current status Planning, Start Up, Enrolling, Closing, Completed, On Hold, Terminated, Data Management. Each card carries the identifying detail you'd otherwise have to look up separately: study name, NCT number, and phase. The column headers carry a live count, so it's immediately visible how many studies sit in each stage without counting rows in a report.
That structure does something a table can't: it makes the shape of the portfolio visible at a glance. A Planning column that's grown heavy relative to Start Up and Enrolling tells its own story either a healthy pipeline building up, or a bottleneck in getting studies moved into execution. Either way, you see it the moment you open the board, not after someone compiles a status report.
6 Signs Your Study Portfolio Needs a Kanban View, Not Another Report
- Answering "how many studies are in Start Up right now" means opening a spreadsheet and counting.
- A study moved between statuses and it took a status meeting for anyone to notice.
- Checking a study's phase or NCT number means opening its full record every time.
- Leadership asks for a portfolio snapshot more often than your reporting cadence produces one.
- Different team members would draw the portfolio's shape differently if asked.
- Spotting where studies are piling up depends on someone manually reviewing a list.
If several of these are familiar, the gap isn't a lack of data it's that the data isn't laid out in a shape that shows its own bottlenecks.
How Cloudbyz CTMS Applies This to Your Study Portfolio
Cloudbyz CTMS's Clinical Studies module offers a native Kanban board across the full study lifecycle Planning, Start Up, Enrolling, Closing, Completed, On Hold, Terminated, and Data Management with every study appearing as a card in its current column and each column showing a live count. Every card surfaces the study name, NCT number, and phase directly, so identifying a study doesn't require opening it first. A single click on a card's action menu pulls up the full study record no separate report, no navigating away from the board to find detail.
For a Clinical Operations Director or VP overseeing a multi-study portfolio, that turns "where does everything stand" from a question that requires assembling a status report into one the board already answers. It pairs naturally with portfolio-level financial visibility in CTFM together, they give leadership one consistent view of both operational and financial status across every active study, rather than two separately reconstructed pictures.
See It Against Your Own Portfolio
If your team is still tracking study status through a spreadsheet or a report that's outdated by the time it's read, it's worth seeing the Kanban view against your actual portfolio. Book a demo with Cloudbyz and we'll show you what it looks like as a board.
Subscribe to our Newsletter
