

Request a demo specialized to your need.
Turn enrollment drift into explainable, forecastable CTFM impacts.
Enrollment is the single most powerful driver of clinical trial timelines, site productivity, and financial outcomes. Yet, in most organizations, enrollment forecasting and financial forecasting continue to live in parallel universes—managed by different teams, updated at different cadences, and reconciled only after variance has already caused material budget and timeline impact.
Enrollment drift—the gradual or sudden deviation between planned and actual patient enrollment—is not merely an operational inconvenience. It is a leading indicator of financial risk across investigator payments, CRO pass-through costs, milestone-based contracts, resourcing plans, and ultimately portfolio ROI.
Clinical Trial Financial Management (CTFM) platforms are uniquely positioned to close this gap by forecasting enrollment drift early, continuously, and with financial context—transforming reactive budget tracking into predictive financial governance.
1. What Is Enrollment Drift—and Why It Matters Financially
Defining Enrollment Drift
Enrollment drift occurs when actual patient accrual diverges from the baseline enrollment plan defined during protocol design and study budgeting. This drift can manifest as:
-
Under-enrollment: slower-than-expected accrual
-
Over-enrollment: faster or higher-than-planned enrollment
-
Temporal drift: enrollment happens, but later than planned
-
Geographic drift: enrollment shifts across regions or sites
Each form introduces distinct financial consequences, often invisible until quarterly or even study-close reconciliations.
Financial Implications of Enrollment Drift
| Drift Type | Financial Impact |
|---|---|
| Slow enrollment | Extended site fees, CRO overhead, monitoring costs |
| Faster-than-planned enrollment | Budget overruns on per-subject costs, lab services, IP |
| Site-level imbalance | Inefficient milestone payments, reforecasting complexity |
| Regional shifts | Currency exposure, tax implications, contract amendments |
Without predictive detection, finance teams are left explaining why budgets moved instead of preventing the movement.
2. Why Traditional CTFM Models Fail to Anticipate Drift
Most CTFM implementations today are ledger-centric, not signal-centric. They rely on:
-
Static enrollment assumptions set at study start
-
Manual reforecasts based on lagging operational reports
-
Periodic variance analysis after costs have already accrued
Structural Limitations
-
Enrollment is treated as an input, not a variable
-
Forecasts are time-based, not behavior-based
-
Financial models are disconnected from site-level reality
-
Reforecasting cycles are monthly or quarterly, not continuous
As a result, by the time finance sees the impact, the organization has already lost optionality.
3. Enrollment Drift as a Leading Financial Indicator
A modern CTFM approach reframes enrollment drift as an early warning signal, not a post-hoc explanation.
Key Principle
Every enrollment event (or non-event) changes the financial future of a study.
Examples of leading indicators embedded in enrollment patterns:
-
Declining screen-to-enroll ratios signal wasted screening costs
-
Delayed first-patient-in at multiple sites predicts milestone slippage
-
Enrollment concentration in high-cost regions forecasts budget overruns
-
Early over-performance at top sites predicts accelerated pass-through spend
CTFM systems that ingest enrollment data continuously can surface these signals weeks or months earlier than traditional reporting.
4. Forecasting Enrollment Drift: A Modern CTFM Framework
4.1 Baseline Modeling Beyond “Patients per Month”
Effective forecasting starts with richer baseline models:
-
Site-specific ramp curves
-
Historical performance by indication and geography
-
Screening failure distributions
-
Enrollment seasonality patterns
-
Protocol complexity coefficients
This shifts forecasting from averages to probability-weighted scenarios.
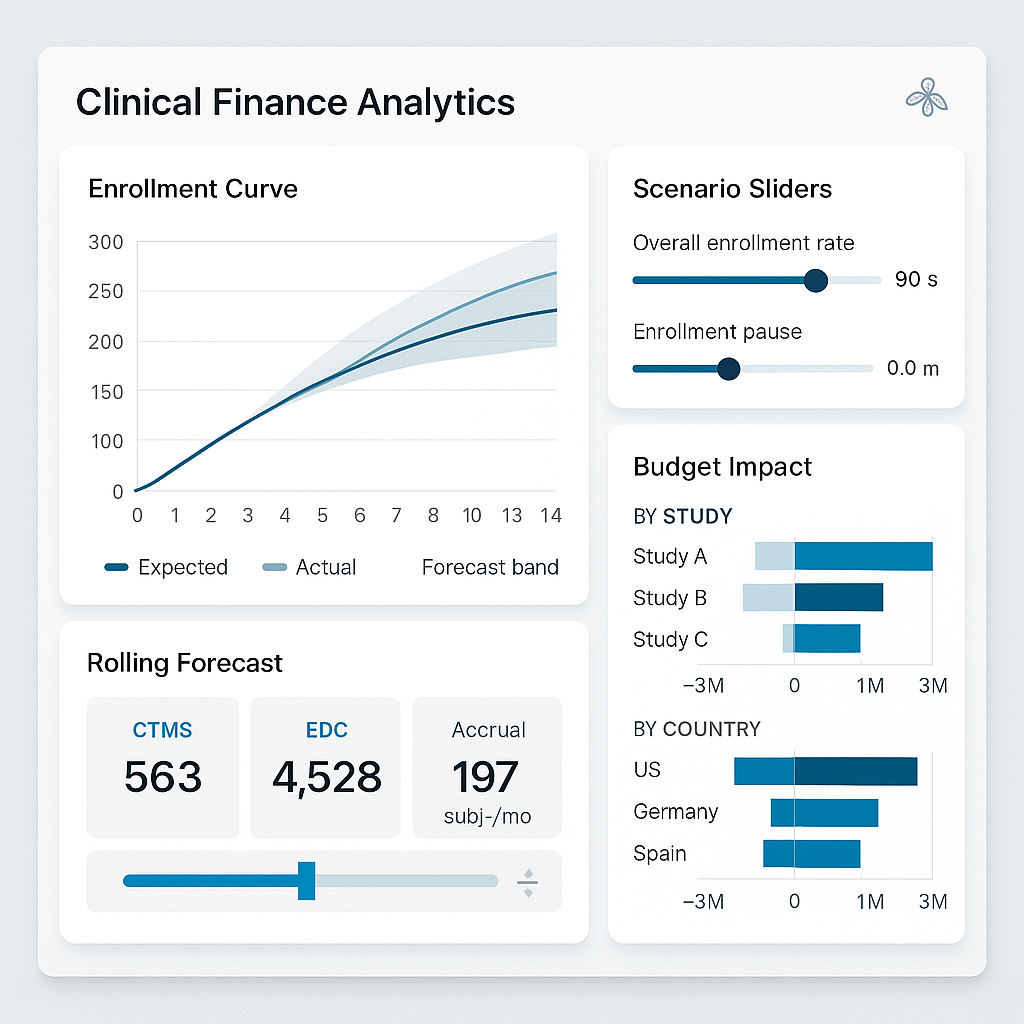
4.2 Continuous Drift Detection
Rather than waiting for missed milestones, advanced CTFM systems track:
-
Expected vs actual cumulative enrollment curves
-
Velocity changes (week-over-week acceleration or deceleration)
-
Site-level deviation bands
-
Region-specific performance anomalies
The moment deviation exceeds tolerance thresholds, financial forecasts are automatically recalculated.
4.3 Financial Impact Propagation
Enrollment drift is only useful if it propagates financially.
Modern CTFM engines should instantly recompute:
-
Investigator grant accruals
-
CRO variable fees
-
Monitoring visit projections
-
Central lab and imaging volumes
-
IP packaging and distribution costs
-
Milestone timing and cash flow
This enables finance leaders to see “If this enrollment trend continues, here is the financial outcome.”
5. Predictive Scenarios: From Reactive to Prescriptive Finance
Scenario-Based Forecasting
Advanced CTFM platforms enable side-by-side views:
-
Baseline Plan
-
Current Trajectory
-
Optimistic Recovery
-
Conservative Delay
-
Mitigation Scenario (e.g., adding sites)
Each scenario includes:
-
Total cost impact
-
Cash flow shifts
-
Margin erosion or recovery
-
Resource implications
Prescriptive Insights
Beyond prediction, best-in-class systems recommend actions:
-
Activate backup sites
-
Reallocate monitoring resources
-
Amend site payment schedules
-
Adjust CRO scope
-
Trigger contingency budgets
Finance becomes a strategic partner, not a reporting function.
6. Governance, Controls, and Trust in Forecasting
Audit-Ready Forecasting
Enrollment-driven forecasts must meet regulatory and audit expectations:
-
Versioned forecast snapshots
-
Clear assumption traceability
-
Role-based approvals
-
Electronic signatures
-
ALCOA+ compliant data lineage
Human-in-the-Loop Design
Forecasting does not replace judgment—it augments it.
-
Finance approves financial assumptions
-
Clinical validates enrollment drivers
-
Operations confirms mitigation feasibility
This shared governance builds trust in predictive outputs.
7. Business Value of Forecasting Enrollment Drift in CTFM
Quantifiable Outcomes
Organizations that proactively forecast enrollment drift typically see:
-
10–20% reduction in unplanned budget overruns
-
Earlier intervention, saving 2–4 months on delayed studies
-
Improved CRO financial accountability
-
Higher forecast confidence at portfolio level
-
Better capital allocation decisions
Strategic Advantage
At the portfolio level, predictive enrollment-aware CTFM enables:
-
More accurate portfolio cash forecasting
-
Smarter pipeline prioritization
-
Reduced end-of-study financial surprises
-
Stronger board and investor confidence
8. The Future: AI-Driven Enrollment Drift Intelligence
The next evolution goes beyond rules and thresholds:
-
Machine learning models trained on historical trial performance
-
AI-driven site performance predictions
-
Automated detection of anomalous enrollment behavior
-
Self-adjusting financial forecasts
-
Natural language explanations for forecast changes
In this future, CTFM becomes a real-time financial nervous system for clinical development.
Conclusion
Enrollment drift is inevitable. Financial surprise is not.
Forecasting enrollment drift within CTFM transforms clinical finance from backward-looking reconciliation to forward-looking orchestration. It enables organizations to see risk earlier, act faster, and govern trials with financial intelligence aligned to operational reality.
In an era of rising trial complexity and constrained R&D budgets, predictive enrollment-aware CTFM is no longer a “nice to have.” It is a strategic imperative for sponsors, CROs, and finance leaders committed to delivering trials on time, on budget, and with confidence.
Subscribe to our Newsletter