

Request a demo specialized to your need.
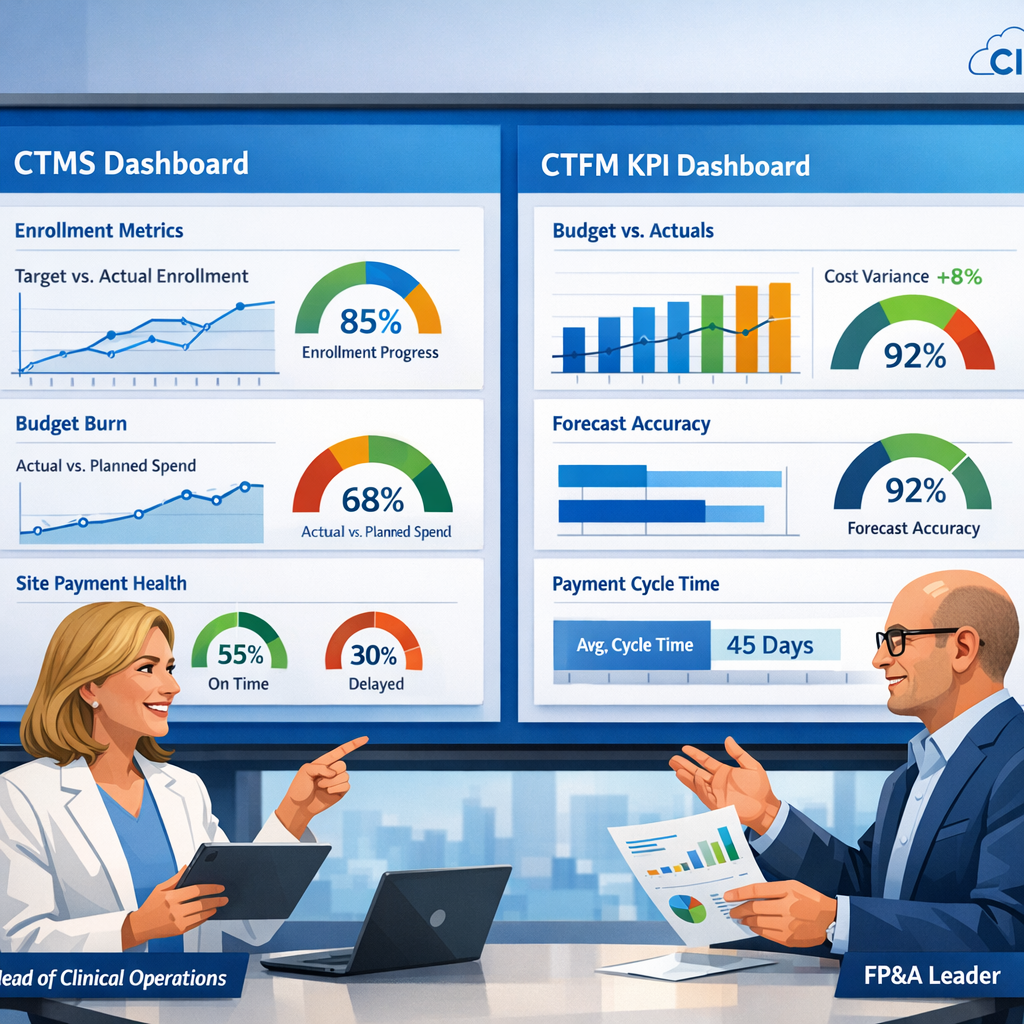
CTMS KPIs that bring clinical operations and FP&A onto the same page for trial performance and spend decisions.
The Metrics That Matter: Building a CTMS KPI Framework Clinical and Finance Leaders Can Actually Agree On
The biggest obstacle to good decision-making in clinical development isn't a lack of data. It's a lack of shared data.
Every portfolio review tells the same story. Clinical operations arrives with enrollment curves, deviation rates, and monitoring backlogs. FP&A walks in with budget variance reports, accrual coverage tables, and cash runway projections. Both teams are working hard. Both teams are working from credible numbers. And yet, the first thirty minutes of the meeting are spent not on decisions, but on reconciliation: arguing about which export is right, which system reflects reality, and whose version of "on track" should govern the conversation.
This is a structural problem, not a people problem. And it demands a structural solution.
Start With the Questions, Not the Metrics
The instinct in most organizations is to begin with available data and build dashboards around it. Module by module, screen by screen: enrollment here, monitoring there, site payments in a separate tab, financials somewhere else entirely. The result is a system that reflects how software is organized, not how executives think.
A better approach inverts the process entirely. Start with the questions that boards and leadership teams actually ask, and work backwards to identify which signals from your CTMS and your clinical trial financial management platform are best positioned to answer them.
Those questions tend to cluster around four themes:
- Milestone integrity: Are we on track to hit the development inflection points that matter to investors and regulators?
- Execution risk: Where are the quality and operational vulnerabilities that could derail delivery?
- Financial velocity: How fast are we burning cash by program, and what levers do we actually have?
- Partner predictability: Which CROs, vendors, and regions consistently support or undermine our forecasting confidence?
From these questions, a minimal, defensible KPI set begins to take shape.
Three Lenses, One Shared Language
The most effective clinical-finance KPI frameworks organize metrics into three lenses: delivery, quality, and financial posture. Each lens speaks to a different dimension of program health, but together they tell a single coherent story.
Delivery tracks whether programs are moving at the pace the plan assumes. Enrollment versus plan by country, the share of sites that are startup-ready relative to target dates, and critical milestone progress are the right signals here. They are concrete, time-bound, and directly connected to both operational execution and financial burn.
Quality captures the integrity of the work being done. Deviation and query aging, protocol-amendment frequency, and eTMF readiness ahead of key events are leading indicators of the regulatory and operational risk embedded in a portfolio. A program that looks on track by enrollment numbers but is accumulating unresolved queries is not actually on track, and the KPI framework should surface that tension clearly.
Financial posture combines budget burn versus plan, accrual coverage (how much recognized cost is supported by actual CTMS evidence), and event-to-payable cycle times for sites and vendors. This lens is where clinical operations and finance find the most common ground, because it denominates operational performance in financial terms both sides understand.
Definitions Are the Foundation
A KPI is only as trustworthy as its definition. This is where many implementations quietly fail.
"Startup ready" should not mean that a study coordinator updated a status flag. It should map to a specific set of milestone states and document checks enforced in the platform. "Verified visit" should mean data complete, data verified, and no open critical queries: not a checkbox toggled under deadline pressure. "Finance-eligible" should align precisely with the eligibility logic your financial management system uses when processing payables and accruals.
When definitions are enforced at the platform level rather than left to individual judgment, something important happens: a red indicator on a dashboard means the same thing for everyone. The study manager sees it. The CFO sees it. And when either one drills down, they find consistent, auditable evidence rather than surprises.
This definitional discipline is the difference between a dashboard executives trust and one they quietly stop looking at.
Design for Decisions, Not for Modules
Once the KPI set is defined, the question becomes how to present it. The answer is to design dashboards that reflect decisions, not system architecture.
A "Program Health" tile should surface enrollment versus plan, startup and closeout readiness, and a quality indicator derived from deviation and query aging, all in a single, scannable view. A "Financial Posture" tile should combine budget burn, accrual coverage, and site-payment SLA performance. Clicking either tile should open a consistent study-level view that pairs operational signals with financial detail: rate-card changes, variance attribution, and aging of unpaid eligible work.
Visual discipline matters as much as content. Executives should be able to scan a portfolio dashboard in under a minute and know where to direct attention. That requires intentional use of color thresholds, compact visualizations instead of dense tables, and business-language labels instead of system jargon. When more detail is needed, drill paths should be predictable and consistent, not detours into entirely separate applications.
Role-based views can tailor the experience without fragmenting the data. A CFO sees the portfolio grouped by phase and therapeutic area. A head of clinical operations sees the same studies grouped by delivery model or CRO. A regional GM sees only the programs relevant to their market. But underneath every view, the same definitions, the same KPIs, and the same data model govern what is shown. That shared foundation is what makes cross-functional conversations productive.
Governance Is Where Dashboards Become Decisions
The most sophisticated dashboard in the world changes nothing if it sits outside the rhythm of how the business is actually run.
The organizations that get the most value from integrated CTMS and financial management platforms build a governance cadence around them: a monthly "clinical-finance cockpit" that brings together heads of clinical operations, R&D, FP&A, and partner leadership. The agenda is deliberately simple: portfolio overview, drill-down on red and amber indicators, and clear decisions framed in terms of operational drivers and financial impact.
Critically, the culture of these meetings should demand specificity. "Budget overrun" and "slow enrollment" are not acceptable explanations. When variance appears, the right question is: which of the usual suspects (volume, rate, mix, timing, or FX) is responsible, and what does the evidence show? If volume drove the variance, the CTMS should show which regions, sites, or visit types diverged from plan. If rate changed, the financial system should show when grants or vendor fees were updated. If timing slipped, milestone histories should reveal exactly where startup, verification, or closeout lagged.
This discipline gradually shifts the culture of portfolio reviews from debate to deliberation. Teams stop arguing about whose numbers are right and start debating which trade-offs they are willing to make.
From Governance to Strategy
The governance model, once established, extends naturally into planning and board reporting.
Instead of rebuilding investor decks from scratch each quarter, leadership can reuse the same KPIs and visualizations executives see every month, with clear commentary on how metrics have moved and why. When boards ask what happens if a key country is delayed or a protocol amendment adds imaging-heavy visits, scenario views built on the same underlying data model can show the operational and financial consequences side by side, in real time.
This is the ultimate test of a well-designed KPI framework: not whether it produces compelling charts, but whether it enables better conversations. Conversations where clinical and financial leaders are looking at the same evidence, speaking the same language, and debating the right questions (trade-offs, priorities, and risk tolerance) rather than the integrity of each other's spreadsheets.
The Minimal Viable KPI Set Is a Strategic Asset
There is a temptation in data-rich environments to measure everything. Resist it. A small, trusted, shared KPI set that is rigorously defined, consistently applied, and embedded in real governance routines is far more valuable than a sprawling metrics catalog that nobody fully believes.
The goal is not comprehensive measurement. The goal is confident decision-making. And that begins with agreeing, across clinical and finance, on what matters, what it means, and where to look when the numbers tell you something has gone wrong.
Building a clinical-finance KPI framework that both sides trust requires more than good software. It requires organizational commitment to shared definitions, shared governance, and a shared standard of evidence. Done well, it is one of the highest-leverage investments a clinical development organization can make.
Subscribe to our Newsletter