

Request a demo specialized to your need.
How biotech CFOs can turn CTMS data into reliable clinical trial cash forecasts and portfolio visibility.
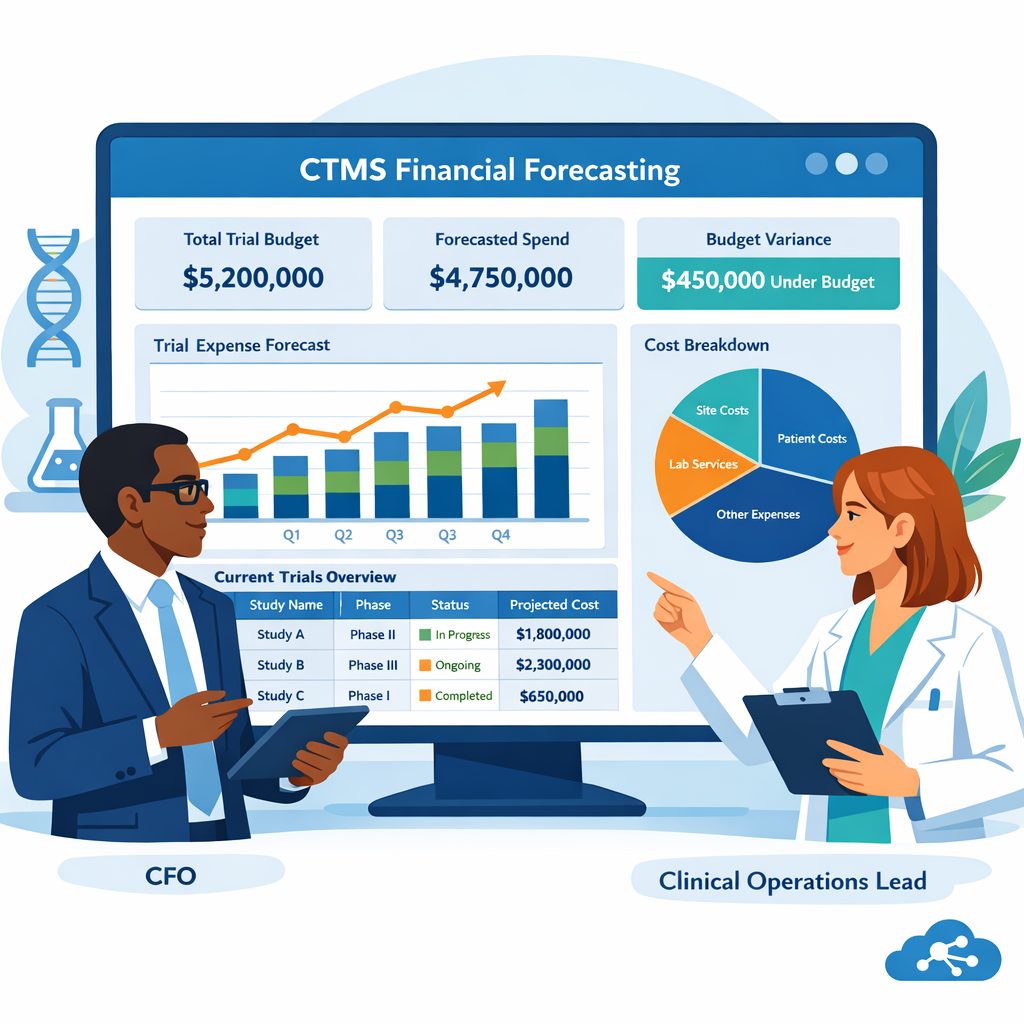
Turning CTMS Activity Data Into Forecast Drivers: A Playbook for Biotech CFOs
The Gap Between Clinical Operations and Financial Forecasting
For emerging biotechs, runway is everything. Boards and investors want to know how long capital will last, which programs are driving burn, and how sensitive plans are to delays, amendments, or expansion.
Yet in many organisations, clinical trial cash forecasting is still built on spreadsheets that sit several steps removed from operational reality. Clinical teams work in CTMS and electronic data capture (EDC); finance teams work in enterprise resource planning (ERP) and planning tools; and the connection between what happens at sites and what appears in forecasts is opaque.
A CTMS-centric operating model gives biotech CFOs a better option. When Cloudbyz CTMS and Clinical Trial Financial Management (CTFM) sit at the centre of the clinical and financial stack, they become the primary drivers of trial cash forecasting. Instead of asking, "How much did we spend last quarter?", finance can ask, "What does CTMS tell us about where we are against plan, and what does that imply for future cash needs?"
Why This Shift Matters Now
Rising protocol complexity, decentralised designs, and global portfolios make static, top-down estimates increasingly unreliable. Without a direct link between protocol design, site performance, and spend, it is hard to explain variances, let alone anticipate them.
Connecting trial budgets to operational data, using modern analytics to track variance, and treating budgeting as a continuous, data-driven process rather than a one-off spreadsheet exercise changes the equation. When those principles are extended to forecasting, CTMS events like site activations, subject enrolment, verified visits, and decentralised assessments become the building blocks of expected cash flows.
For CFOs, the payoff is a richer, more defensible view of runway. Forecasts grounded in CTMS and CTFM data can show not only total spend by study, but also the timing of that spend relative to milestones, expected amendments, and portfolio gating decisions. That clarity makes it easier to answer tough questions from boards, partners, and potential acquirers, and to adjust plans before surprises consume scarce capital.
Building Driver-Based Cash Forecasts Across the Portfolio
Once finance leaders accept that CTMS and CTFM must be the primary sources of truth for trial economics, the next step is to build repeatable, driver-based forecasting models on top of that data. The goal is not to predict a single future, but to understand how cash needs move when operational assumptions change, and to do so in ways that auditors and investors recognise as disciplined.
A Library of Forecasting Drivers
A practical design pattern is to create a small library of forecasting drivers that live directly in Cloudbyz. Instead of building each budget and forecast from scratch in spreadsheets, CFOs and clinical finance teams define:
- Standard enrolment archetypes including screen failure rates, site ramp-up curves, and projected recruitment timelines
- Country and site tiers reflecting cost differences by geography and site capability
- Visit templates covering visit cadence, intensity, and procedure mix
- Decentralised elements such as remote monitoring, ePRO, home nursing, and hybrid visit structures
Each driver has operational attributes in CTMS and financial attributes in CTFM (per-visit fees, startup and closeout packs, central vendor charges). When CTMS shows actual events diverging from plan, whether sites activating later, subjects enrolling faster, or high-intensity visits exceeding expectations, CTFM can update forecasts by recalculating event volumes and applying the same rate logic.
Making Sensitivities Explicit
Small shifts in procedures, eligibility criteria, or geography can push total cost and cash needs far off early estimates. CTMS-driven drivers make those sensitivities visible: a change in visit schedule or imaging intensity becomes a change in forecasted events and costs, surfaced on dashboards rather than buried in cell formulas.
From Trial-Level to Portfolio View
Across a portfolio, this approach allows biotech CFOs to move from trial-by-trial spreadsheets to a consolidated view of expected R&D cash flows. Analytics can roll up forecast outputs by program, phase, and therapeutic area, showing quarter-by-quarter cash requirements and highlighting where risky designs concentrate spend.
For emerging biotechs, the payoff is a clearer runway story. Instead of translating protocol complexity and geographic expansion into rough rules of thumb, CFOs can show boards and investors how each strategic choice changes forecasted burn, grounded in the operational reality CTMS tracks every day.
Partnering Clinical and Finance Teams Around Shared CTMS Views
Even the best forecasting models will be ignored if clinical and finance teams continue to work in silos. To make CTMS-driven cash forecasts matter, organisations have to change how they review data and make decisions.
Anchoring Reviews in Shared Dashboards
A first step is to anchor regular "clinical and financial health" reviews in shared CTMS and CTFM dashboards. Rather than presenting separate slide decks, clinical operations and finance open the same views: enrolment and visit curves, startup and closeout milestones, budget burn and variance, forecast updates, and event-to-cash metrics.
When numbers look off, for example when spend is ahead of plan while CTMS event volumes lag, teams can drill down together to identify whether the issue is missing data, misconfigured rate logic, or genuine overspend.
From Reporting to Joint Planning
Over time, these rituals help shift the culture from "finance reports on what happened" to "clinical and finance plan together." When clinical leaders propose adding countries, decentralised components, or new endpoints, finance partners can respond with scenario views generated from CTMS drivers rather than generic pushback. CTFM's ability to turn updated CTMS assumptions into revised cash projections in near real time makes it much easier to explore options without losing control.
Governance That Reinforces the Change
A CTMS and CTFM steering group that includes the CFO or VP of finance, along with heads of clinical development and operations, can own forecasting standards, scenario definitions, and portfolio dashboards. Extending this group's remit to include cash forecasting ensures that trial-level insights roll up into capital allocation decisions.
A Differentiator for Investor Communication
For investor-facing communication, CTMS-driven forecasting becomes a genuine differentiator. Biotech CFOs can explain not only how much cash they need, but also why: which programs, country mixes, and design choices are driving burn, and how quickly they can flex spend up or down if conditions change. Because those narratives are backed by CTMS event histories and CTFM logic, they carry more weight than high-level charts detached from clinical reality.
Subscribe to our Newsletter